Hello All,
Hope you are enjoying our articles on Pharmacovigilance and Drug Safety related topics. Today we will discuss in brief about Qualitative and Quantitative signal detection in Pharmacovigilance.
 |
| Signal detection in Pharmacovigilance |
Signal
A Signal is an “information that arises from one or multiple sources (including observations and experiments), which suggests a new potentially causal association, or a new aspect of a known association, between an intervention and an event or set of related events, either adverse or beneficial, that is judged to be of sufficient likelihood to justify verificatory action”.
The selection of an appropriate signal detection method is very much crucial in the identification process of safety signals in pharmacovigilance. A primary aim of pharmacovigilance is the timely detection of either new adverse drug reactions (ADRs) or a relevant change of the frequency of ADRs that are already known to be associated with the drugs involved, i.e. signal detection.
Adequate signal detection solely based on the human intellect (case-by-case analysis or qualitative signal detection) has proven its value. However, it is becoming increasingly time consuming given the growing volume of data, as well as less effective, especially in more complex associations, such as drug-drug interactions, syndromes and when various covariates are involved.
Signal detection methods
There are two broad categories of signal detection methods, i.e. Qualitative and Quantitative. Each method have its own significance.
A) Qualitative Signal detection:
This is a diagnostic process and involves case by case analysis.
Qualitative signal detection methods include review of scientific content utilizing:
- ICSRs recorded in the global Pharmacovigilance database, including both solicited and unsolicited ICSRs.
- Review of aggregate safety data.
- The periodicity of review of marketed products, defined by the prioritization process
- Literature review to identify new potential safety findings.
- Lot review for manufacturing investigations.
- The safety topics of interest for which the safety data are to be reviewed on a routine basis for marketed product.
B) Quantitative Signal detection:
In quantitative signal detection, measures that express the extent in which combinations of drug(s) and clinical event(s) are disproportionately present in the database of reported suspected ADRs are used to reveal associations of interest.
Although the rationale and the methodology of the various quantitative approaches differ, they all share the characteristic in that they express to what extent the number of observed cases differs from the number of expected cases.
Recent years have shown that the use of quantitative measures in addition to qualitative analysis is a step forward in signal detection in pharmacovigilance.
Quantitative signal detection is based on the review of a type of quantitative metric calculated on the internal Company PV database. It also includes computational and statistical methods, e.g. data mining algorithms for disproportionality analyses in external spontaneous reporting databases (VAERS, FAERS and VigiBase) to screen for signals of disproportionate reporting and thus, identify drug-event combinations further subject to threshold algorithms and medical judgment, which may be requested on an ad hoc basis during signal evaluation.
Quantitative methods are utilized by the EudraVigilance signal detection report, also known as the electronic Reaction Monitoring Report (eRMR), which includes quantitative parameters based on the lower bound of the 95% Confidence Interval of the Reporting Odds Ratio (ROR(-)).
1. SDRs (Signals of disproportionate reporting)
SDRs refer to statistical associations between medicinal products and adverse events i.e. drug event pairs. They should be distinguished from ‘potential signals’ that can originate from individual case analysis and formal epidemiological studies. Different statistical methods to generate SDRs are in use. In the EudraVigilance Data Analysis System, the Proportional Reporting Ratio (PRR) has been implemented in the first release.
2. ROR (Reporting Odds Ratio)
The odds of a certain event occurring with your medicinal product, compared to the odds of the same event occurring with all other medicinal products in the database.
A signal is considered when the lower limit of 95% confidence interval (CI) of the ROR is >1. The 95% CI gives an indication of the precision of the estimate of ROR.

The ROR is calculated and expressed as a point estimate with 95% confidence interval (CI)
3. PRR (Proportional Reporting Ratio)
The PRR is a statistical method used to detect SDRs in pharmacovigilance databases such as EudraVigilance. This method relies on the principle that when a SDR (involving a particular adverse event) is identified for a medicinal product (referred to medicinal product P), this adverse event is reported relatively more frequently in association with this medicinal product P than with other medicinal products.
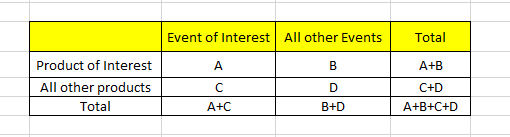
The general criteria to run the PRR are as follows:
A: indicates the number of individual cases with the suspect medicinal product P involving an adverse event R.
B: indicates the number of individual cases related to the suspect medicinal product P, involving any other adverse events but R.
C: indicates the number of individual cases involving event R in relation to any other medicinal products but P.
RRR is the ratio of how many adverse drug reactions (ADRs) under exposure were actually observed over the number of expected events under the assumption that ADR and drug exposure were independent.
RRR is calculated as:
RRR=P (drug i, ADR j)/P (drug i). P (ADR j)
P (drug i): probability of a target exposure being reported
P (ADR j): probability of target event being reported
P (drug i) & P (ADR j): joint probability of a report on target event under exposure to the target drug
RRR value of 1 indicates normal background noise. Increase in RRR indicates an over proportional association between drug and adverse event. RRR value lower than 1 indicates a negative association
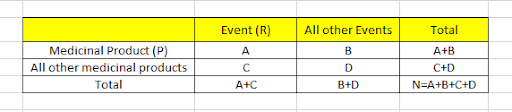
4. Chi square
χ2 greater than or equal to 4 is indicator of considering signal.
A: No. of Individual cases with suspect product P, involving adverse event R
B: No. of Individual cases related to suspect product P, involving any other adverse events but R
C: No. of Individual cases involving event R in relation to any other medicinal products but P
D: No. of Individual cases involving any other adverse events but R and any other medicinal products but P
5. MGPS (Multi-Item Gamma Poisson Shrinker)
6. BCPNN (Bayesian Confidence Propagation Neural Network)
There is no single universal method that would be a perfect fit to identify safety signals from all data sources or for all types of adverse events. Further, the signal detection process involves a series of steps right from signal detection to its final assessment & submission, to regulatory authorities confirming a signal as a ‘possible safety alert’.